10-Apr-2023
.
Admin

hii guys,
In this example,I will show you how to add charts using highcharts in laravel 6 application.we will use highcharts library for add bar chart in laravel 6 application.
here we will see that how to use chart using highcharts laravel 6.
Highcharts library is used to add bar chart, line chart, area chart, column chart etc.this is useful when you want to add chart in application as per recuirement easily with less code.
Follow below step to use bar chart in your application :
Install Laravel 6
you will create laravel 6 fresh application.
composer create-project --prefer-dist laravel/laravel ChartsUsingHighcharts
Create Table
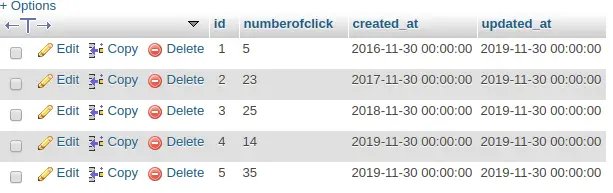
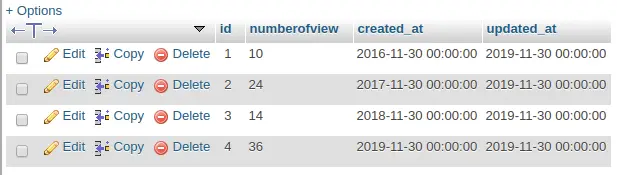
Here you will create two table click and view like as below :
Click Table
View Table
Create Route
Add highchart route in web.php file :
routes/web.php
Route::get('/highchart', 'HighchartController@highchart')->name('highchart');
Create Controller
Type below command to create HighchartController :
php artisan make:controller HighchartController
Update controller file like as below :
app/Http/Controllers/HighchartController.php
<?php

namespace App\Http\Controllers;

use Illuminate\Http\Request;
use App\View;
use App\Click;

class HighchartController extends Controller
{
    public function highchart()
    {
        $viewer = View::select(\DB::raw("SUM(numberofview) as count"))
                    ->groupBy(\DB::raw("year(created_at)"))
                    ->pluck('count');

        $click = Click::select(\DB::raw("SUM(numberofclick) as count"))
                    ->groupBy(\DB::raw("year(created_at)"))
                    ->pluck('count');

        return view('highchart',compact('viewer','click'));
    }
}
Create Blade File
Put below code in highchart blade file :
resources/views/highchart.blade.php
<!DOCTYPE html>
<html>
<head>
    <title>High Chart Example</title>
</head>
<body>
    <div id="highchart"></div>
    <script src="https://cdnjs.cloudflare.com/ajax/libs/jquery/3.4.1/jquery.min.js"></script>
    <script src="https://code.highcharts.com/highcharts.js"></script>
    <script type="text/javascript">
        $(function () {
            var dataClick = {{ json_encode($click,JSON_NUMERIC_CHECK) }};
            var dataViewer = {{ json_encode($viewer,JSON_NUMERIC_CHECK) }};
            $('#highchart').highcharts({
                chart: {
                    type: 'column'
                },
                title: {
                    text: 'Yearly Website Ratio'
                },
                xAxis: {
                    categories: ['2016','2017','2018', '2019']
                },
                yAxis: {
                    title: {
                        text: 'Rate'
                    }
                },
                series: [{
                    name: 'Click',
                    data: dataClick
                }, {
                    name: 'View',
                    data: dataViewer
                }]
            });
        });
    </script>
</body>
</html>
Layout
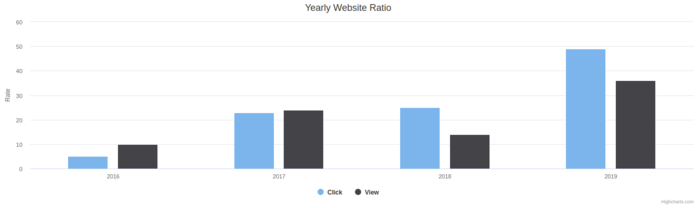
It will help you....
#Laravel
#Laravel 6