Laravel 8 Charts JS Chart Example Tutorial
Teams applying “Laravel 8 Charts JS Chart Example Tutorial” in a production project can use essential job function to record implementation, review and debugging time, then compare that effort with tests and shipped functionality instead of treating activity as performance by itself.
Before copying the example into a live application, confirm version-specific behaviour with the official Laravel website and test it against the project’s actual database and runtime.
Hi Guys,
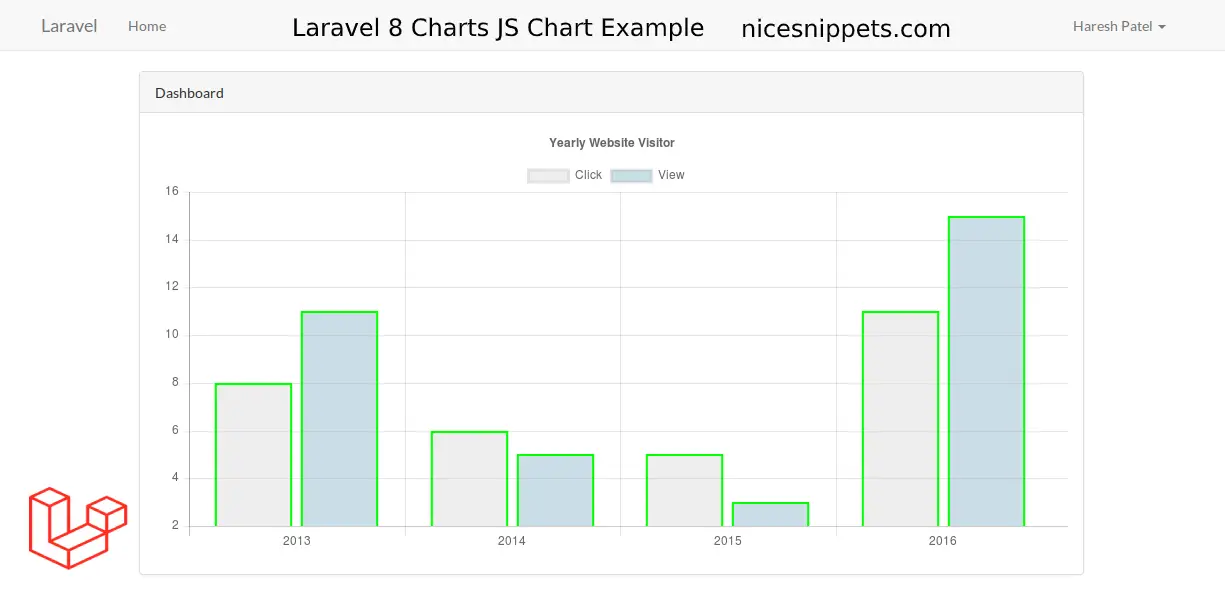
In this blog, I will learn you how to use Charts JS Chart in laravel 8. we will show example of laravel 8 charts js chart.Laravel 8 Blade template engine is awesome. you can easyly use PHP variable, js and js library in laravel 8 view. i will create chart using Chart.js in laravel 8 application. Chartjs is a js library, this library through we can use bar chart, line chart, area chart, column chart etc, C]chart.js also provide sevral theme.
whenever you need to add charts in laravel 8 server side. then you can easily use following example you have to fetch data from database and then set in Chart JS function, In this post i will give you simple example to create bar chart using chart js that way you can use in your laravel 8 application.
Here, I will give you full example for laravel 8 charts js chart as bellow.
Step 1: Route
In this step, first add chartjs route in your routes.php file.
use App\Http\Controllers\ChartJsController;
Route::get('chartjs', [ChartJsController::class, 'index'])->name('chartjs.index');
Step 2: Create Controller we are going to create a controller for following commands:
php artisan make:controller ChartJsController Now you can edit the file in app/Http/Controllers/ChartJsController.php.
namespace App\Http\Controllers;
use Illuminate\Http\Request;
use App\Models\User;
use DB;
use Carbon\Carbon;
class ChartJsController extends Controller
{
    public function index()
    {
        $year = ['2015','2016','2017','2018','2019','2020'];
        $user = [];
        foreach ($year as $key => $value) {
            $user[] = User::where(\DB::raw("DATE_FORMAT(created_at, '%Y')"),$value)->count();
        }
    	return view('chartjs')->with('year',json_encode($year,JSON_NUMERIC_CHECK))->with('user',json_encode($user,JSON_NUMERIC_CHECK));
    }
}
Step 3: Create blade file
In this step,i will create chartjs view file.
@extends('layouts.app')
@section('content')
<div class="container">
    <div class="row">
        <div class="col-md-10 offset-md-1">
            <div class="panel panel-default">
                <div class="panel-heading">Dashboard</div>
                <div class="panel-body">
                    <canvas id="canvas" height="280" width="600"></canvas>
                </div>
            </div>
        </div>
    </div>
</div>
<script src="https://cdnjs.cloudflare.com/ajax/libs/Chart.js/2.9.3/Chart.min.js"></script>
<script>
    var year = <?php echo $year; ?>;
    var user = <?php echo $user; ?>;
    var barChartData = {
        labels: year,
        datasets: [{
            label: 'User',
            backgroundColor: "pink",
            data: user
        }]
    };
    window.onload = function() {
        var ctx = document.getElementById("canvas").getContext("2d");
        window.myBar = new Chart(ctx, {
            type: 'bar',
            data: barChartData,
            options: {
                elements: {
                    rectangle: {
                        borderWidth: 2,
                        borderColor: '#c1c1c1',
                        borderSkipped: 'bottom'
                    }
                },
                responsive: true,
                title: {
                    display: true,
                    text: 'Yearly User Joined'
                }
            }
        });
    };
</script>
@endsection
It will help you....
- How to Notifications With database Driver in Laravel 11?
- How to Send Email Via Notification in Laravel 11?
- How to Install and Configure Laravel 11 Debugbar?
- How to Like Dislike System in Laravel 11?
- How to Paginate a Model with Relationship in Laravel 11?
- Laravel 11 Upload Files to Amazon S3 Example
- Laravel 11 Send WhatsApp Messages Example
- Laravel 11 Rest API Authentication Using JWT Tutorial